If you’ve ever stood by a river, lake, or even a municipal water tap and wondered what exactly goes into making that water safe, chances are an online water quality analyzer played a part in monitoring it. For years, I’ve worked as part of the team supplying these analyzers to treatment plants, food and beverage facilities, and industrial operations across the country, and I’ve lost count of how many clients have come to me saying, “The numbers look right… but what do they actually mean?” It’s a question that trips up new operators and seasoned professionals alike—interpreting the data from these devices isn’t just about reading a number off a screen. It’s about connecting that number to real-world conditions, regulatory standards, and the unique needs of your operation. Today, I want to break that down, straight from the perspective of someone who’s seen the difference between a misinterpreted reading and a confident, data-driven decision. Online Water Quality Analyzer
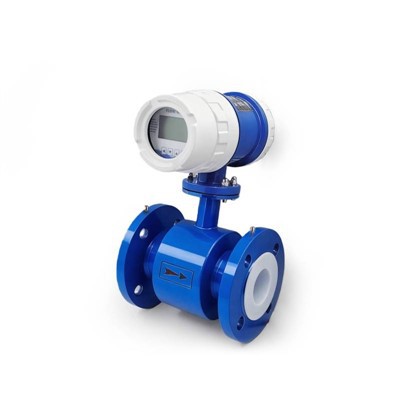
Let’s start with the basics. When your online water quality analyzer sends a reading to your dashboard, it’s not just a random digit. Most modern analyzers are built to measure core parameters: pH, turbidity, dissolved oxygen (DO), total dissolved solids (TDS), and often specific contaminants like chlorine or nitrates. Each of these tells a different story, and the first step to interpreting them is knowing what your analyzer is actually calibrated to measure—and when. I once had a client at a small municipal treatment plant who thought their turbidity reading meant the drinking water was unsafe, only to realize their analyzer was calibrated for raw wastewater, not finished drinking water. Calibration drifts and device settings are the unsung culprits here, and that’s why the first rule of interpreting data is always cross-reference your reading with the analyzer’s last calibration date and the parameter it’s designed to test. If it’s been two weeks since you calibrated for pH, a reading that’s slightly off might not be a problem with your water—it’s a problem with your device.
Take pH, for example, one of the most common parameters measured by online analyzers. Most people know pH measures acidity or alkalinity on a scale of 0 to 14, but interpreting the reading requires context. For drinking water, the EPA recommends a pH range of 6.5 to 8.5 to protect pipe infrastructure and ensure disinfectants like chlorine work properly. But if you’re running a food and beverage facility that brews beer, that range might be far narrower—around 4.0 to 4.5—because it impacts flavor and yeast activity. Last year, a craft brewery client called me in a panic saying their pH readings were dropping 0.2 points below their target, thinking their water treatment system was failing. A quick check showed the analyzer was located near the plant’s carbon dioxide injection line, and the slight, localized dip in pH there wasn’t a sign of a system failure—it was normal process variation. The key here is that a “good” number for one operation is a “bad” number for another, and you can’t interpret data in a vacuum.
Next up is turbidity, which measures the cloudiness of water caused by suspended particles like sediment, algae, or microplastics. For drinking water, turbidity is one of the EPA’s most strictly monitored parameters because even small amounts of particles can shield harmful bacteria from chlorine disinfection. The standard limit is less than 0.5 nephelometric turbidity units (NTU) for finished drinking water, but raw wastewater might have a turbidity reading of 100 NTU or higher. I’ve seen operators get confused when they see a turbidity reading spike after a heavy rain—those spikes are common because stormwater washes sediment into source water reservoirs. The important part isn’t just the spike itself, but how quickly your analyzer detects it. Online analyzers provide real-time data, unlike grab samples taken once a day, so they can alert you to a spike minutes after it starts, giving you time to adjust your coagulation process to remove the extra particles before they reach the treatment plant’s end. That’s the difference between interpreting a static lab result and using continuous data to prevent problems before they start.
Dissolved oxygen (DO) is another parameter that trips people up, especially those working with aquaculture or wastewater treatment. DO measures the amount of oxygen dissolved in water, and it’s critical for aquatic life—most fish need at least 5 mg/L to survive. For wastewater treatment plants, aeration tanks are designed to maintain DO levels between 2 and 3 mg/L to help bacteria break down organic waste. But I once had a client at a seafood processing plant who thought their DO reading was too low, until they realized their analyzer was measuring DO at 2 a.m., when the water temperature was at its daily lowest. Warm water holds less oxygen, so a DO reading of 6 mg/L at night would be normal, while the same 6 mg/L reading on a hot summer afternoon might be a sign of aeration failure. That’s why interpreting data also means considering environmental context: water temperature, time of day, and even barometric pressure can all impact DO levels, so a single number doesn’t tell the whole story.
Total Dissolved Solids (TDS) is often misunderstood too. TDS measures all the inorganic and organic substances dissolved in water, like salts, minerals, and metals. For drinking water, the EPA has no strict limit for TDS, but most people find water with TDS above 1,000 mg/L tastes salty or bitter. For industrial operations, TDS is a bigger deal: power plants need low-TDS water to prevent scaling in boilers, and reverse osmosis systems that purify water will shut down automatically if TDS exceeds a certain threshold. I had a client at a textile factory who kept seeing TDS readings climb after they switched to a new batch of raw water from a local well. Instead of blaming the analyzer, we checked their other process data and found the TDS spike aligned with a new irrigation project upriver that was pumping saltwater into the aquifer. The analyzer’s data didn’t just alert them to a problem—it helped them pinpoint its source, which was upriver, not in their treatment equipment.
Now, let’s talk about common pitfalls that even experienced operators fall into. One of the biggest is overreacting to small, normal variations. Online analyzers measure data every few seconds, so you’re going to see tiny, random fluctuations—maybe a pH reading that bounces between 7.2 and 7.3 for no obvious reason. A full 1-point shift in pH is a problem, but a 0.1-point shift is just noise from the sensor. Another pitfall is ignoring the baseline. Every body of water has a natural baseline, and comparing your current reading to that baseline is far more useful than comparing it to a one-size-fits-all regulatory number. For example, a river might naturally have a nitrate level of 2 mg/L, while the EPA’s limit for drinking water is 10 mg/L. If that river’s nitrate reading jumps to 5 mg/L, that’s a warning sign even though it’s still below the regulatory limit. An online analyzer that tracks baseline data over weeks or months can help you spot those trends before they become critical.
I’ve also seen clients misinterpret data because they’re only looking at individual parameters, not how they work together. Turbidity and chlorine levels, for example, are linked: if turbidity is high, chlorine will bind to the suspended particles and become less effective at killing bacteria, so you might need to adjust your chlorine dose even if your turbidity reading is still within limits. Last year, a client at a small town water system noticed their chlorine reading was dropping unexpectedly, even though they’d calibrated their analyzer and added more chlorine. When we checked the turbidity data, we saw a spike that coincided with the chlorine drop—they needed to adjust their chemical feed rate to match the turbidity spike, not just rely on the chlorine reading alone. That’s the power of interpreting data holistically, not in silos.
So what’s the actionable takeaway here? First, know your analyzer: keep track of calibration dates, understand what each parameter actually measures, and test your analyzer against lab samples regularly to cross-verify readings. Second, understand your operation’s unique needs: regulatory standards are a minimum, but your facility might have stricter internal targets to avoid downtime or product issues. Third, consider context: environmental conditions, process trends, and the relationships between different parameters all shape what a reading means. Fourth, don’t ignore trends: look at data over hours, days, or weeks instead of just individual readings—spikes and dips that last minutes might be noise, but trends that last days are worth investigating.
At the end of the day, online water quality analyzers are only as useful as the person interpreting their data. They remove the delay of grab samples and give you real-time insights, but they can’t tell you what’s normal for your water or your operation. That’s why I always tell clients: if your gut says a reading doesn’t add up, it’s worth double-checking. Whether you’re a new operator just learning your dashboard or a seasoned manager looking to optimize your process, taking the time to understand your analyzer’s data will save you from costly mistakes, help you stay compliant, and ensure your water is safe for whatever you use it for.
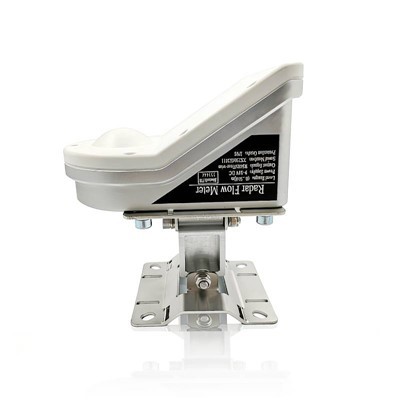
If you’re looking to upgrade your online water quality monitoring system, or if you have questions about interpreting the data from your current analyzer, we’re here to help. Our team has years of experience working with facilities like yours, and we can provide tailored guidance on calibration, data interpretation, and maintenance to make sure you’re getting the most out of your monitoring tools. Don’t let ambiguous data lead to avoidable problems—reach out today to learn more about our solutions and how we can support your operation.
Radar Flow Meter References
- U.S. Environmental Protection Agency. (2023). Drinking Water Standards and Health Advisories. Office of Water.
- American Water Works Association. (2022). Water Quality Monitoring: A Practical Guide for Operators. AWWA Press.
- World Health Organization. (2021). Guidelines for Drinking-water Quality, 4th ed. WHO Press.
- Rice, E. W., Baird, R. B., & Eaton, A. D. (2022). Standard Methods for the Examination of Water and Wastewater, 23rd ed. American Public Health Association.
Dalian Yheng Technology Co., Ltd.
Dalian Yheng Technology Co., Ltd. is one of the leading online water quality analyzer manufacturers and suppliers in China, also supports customized service. We warmly welcome you to buy high quality online water quality analyzer in stock here from our factory. Contact us for more details.
Address: F1605, NO.10 Huoju road, High-tech Industrial Zone, Dalian, China
E-mail: admin@dlyheng.com
WebSite: https://www.yhengphmeter.com/
